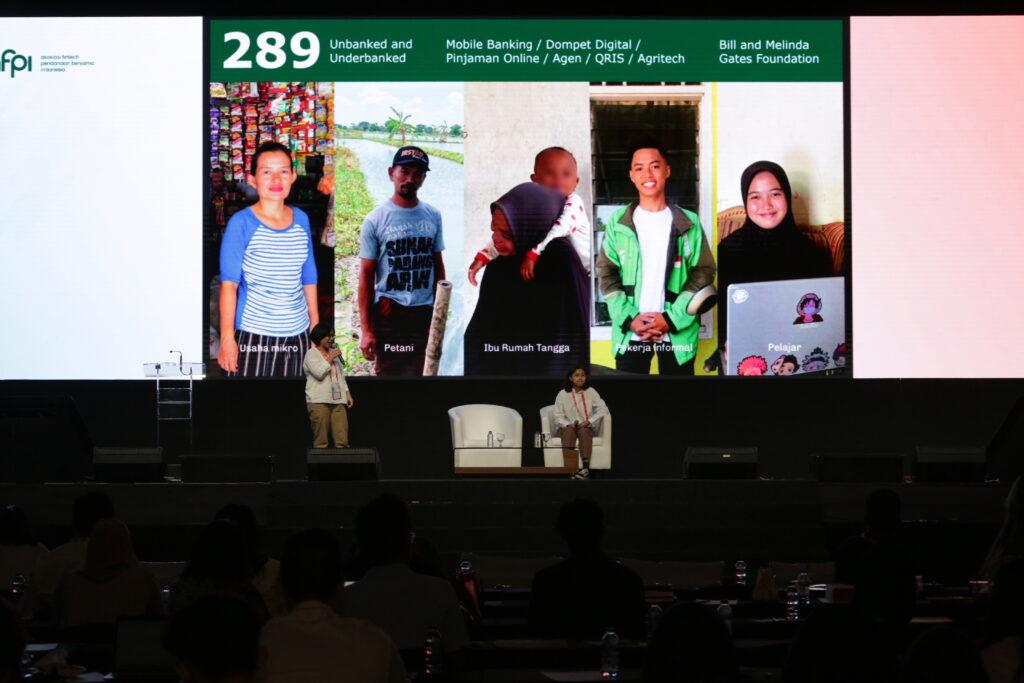
The project aims to identify key challenges and opportunities in the onboarding process and produce actionable and localized insights that directly benefit digital financial inclusion activities. Unbanked and underbanked included here are farmers, informal workers, micro-entrepreneurs, and economically inactive (Students & Wife). The project also focuses on more rural areas where the conventional banking infrastructure is typically lower. The research is done in parallel in 4 different countries which has big number of unbanked underbanked population: Indonesia, India, Bangladesh and Uganda.

The Impact

We shared the research results in different dissemination forms with different relevant stakeholders, such as 1-on-1 sharing sessions with partnered key players, conference talks, and sharing series such as:

  • 1-on-1 sharing session with more than 7 different service providers and relevant stakeholders
  • Speaker in UXA Masterclass Conference 2023 in Spain (120+ attendees)
  • Speaker in Somia Conference 2023: System Thinking in Design (120+ attendees)
  • Visionary Talk and Exhibition Booth in Indonesia Fintech Summit 2023 (3000+ visitors)

Our Approach

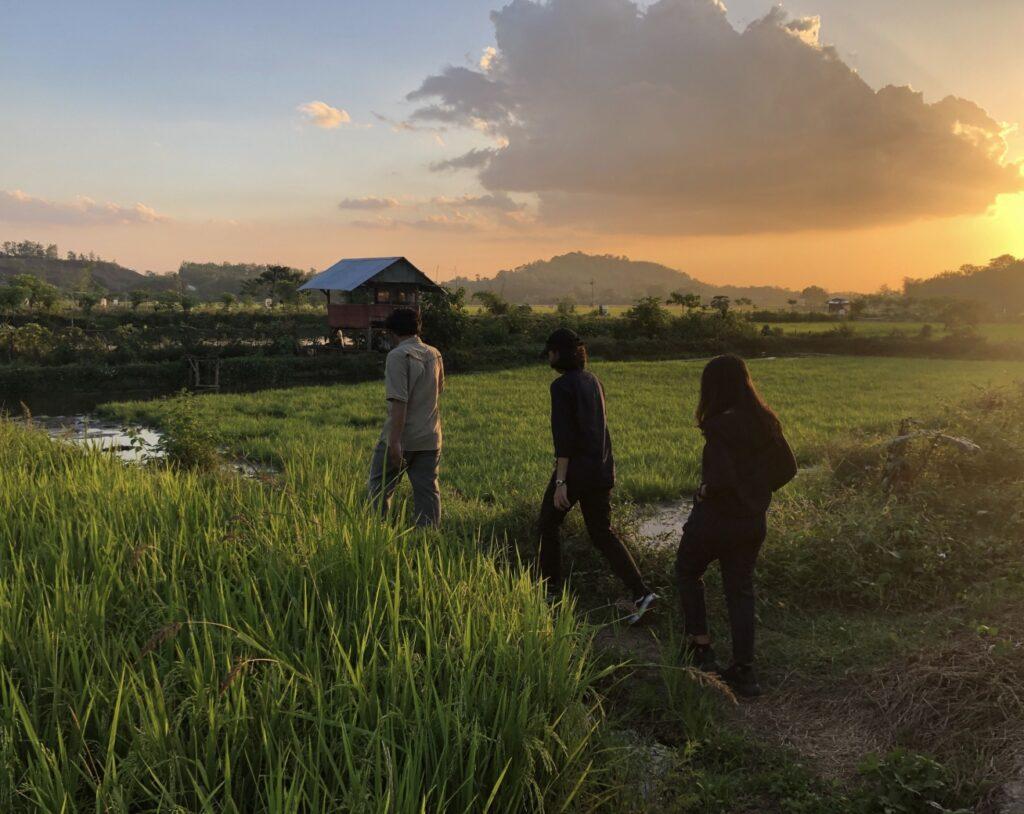
The research is conducted in 3 provinces: North Sumatra, East Java and South Sulawesi, as representative of the west, central and east region of Indonesia to best represent the geographical context. This locations are selected as they have barriers in limited banking infrastructure, low economy and financial literacy but have good internet penetration and digital availability as the basic requirements of the adoption. 

The thick research uses an ethnographic approach to discover and document the onboarding journey of different segments in different services (agri-tech, mobile & digital banking, digital wallet, digital lending, QRIS, and government aid – PKH & Prakerja).

ECOSYSTEM & STAKEHOLDER LEVEL

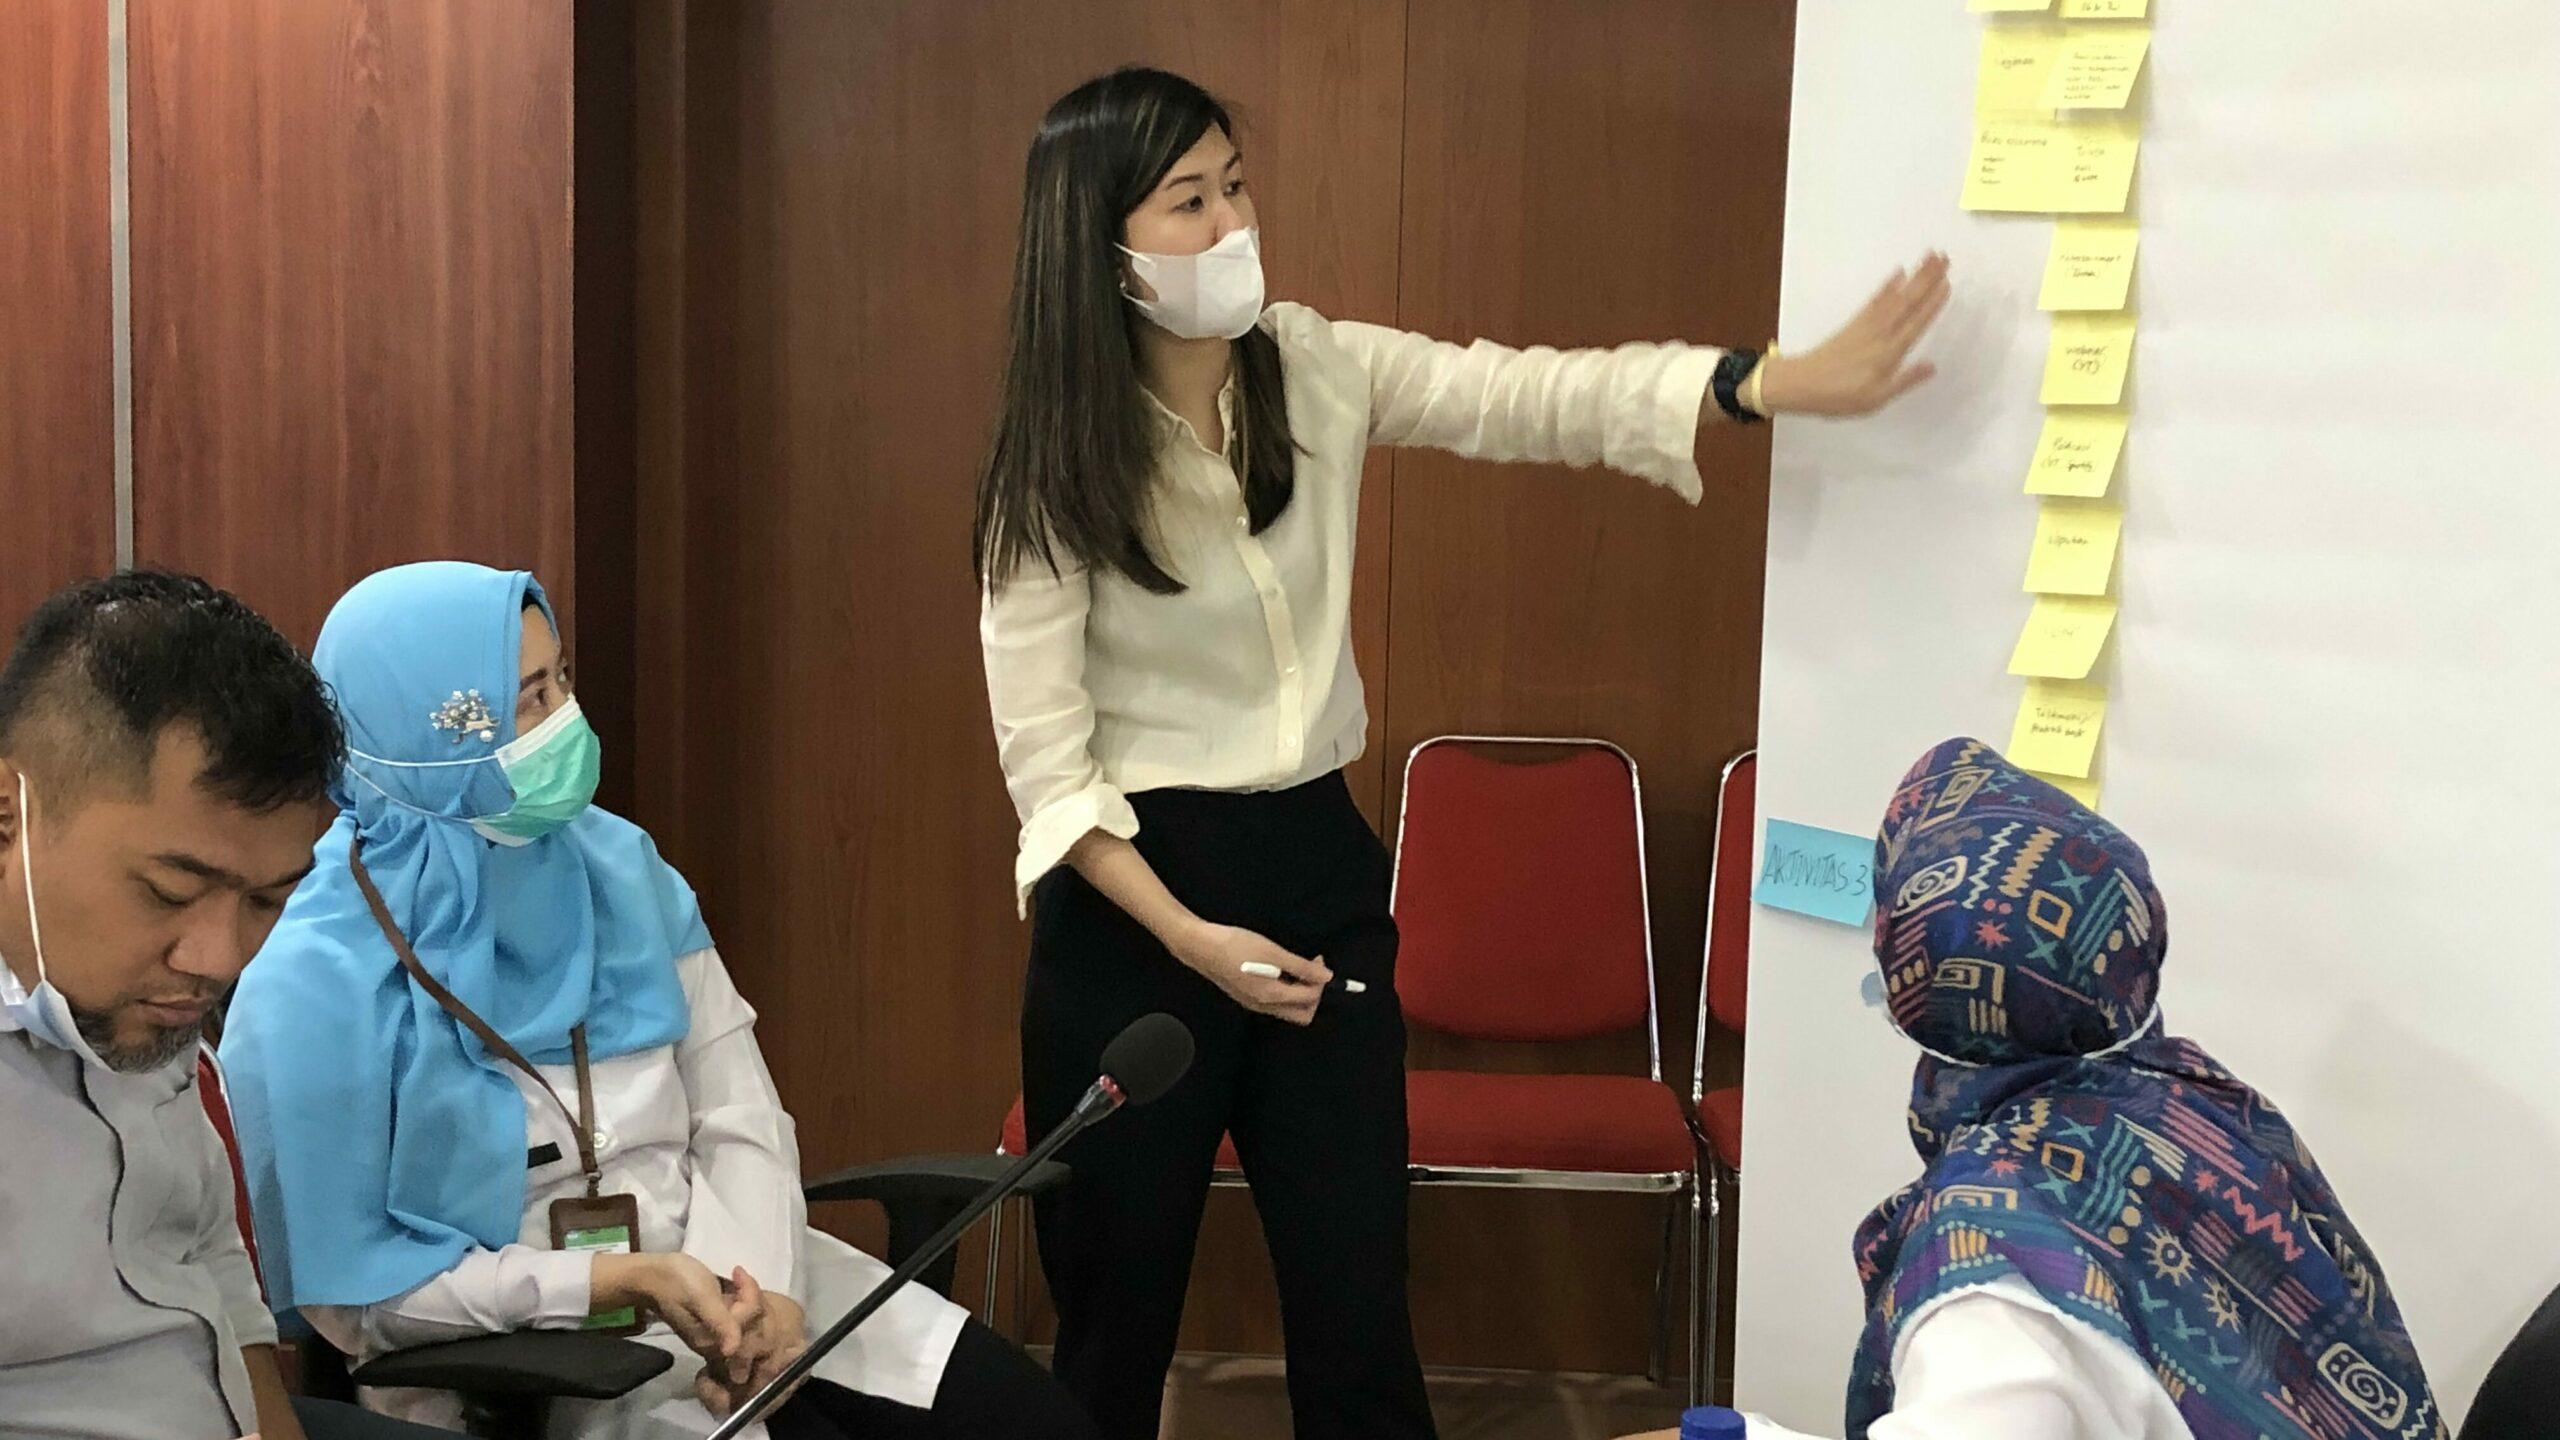
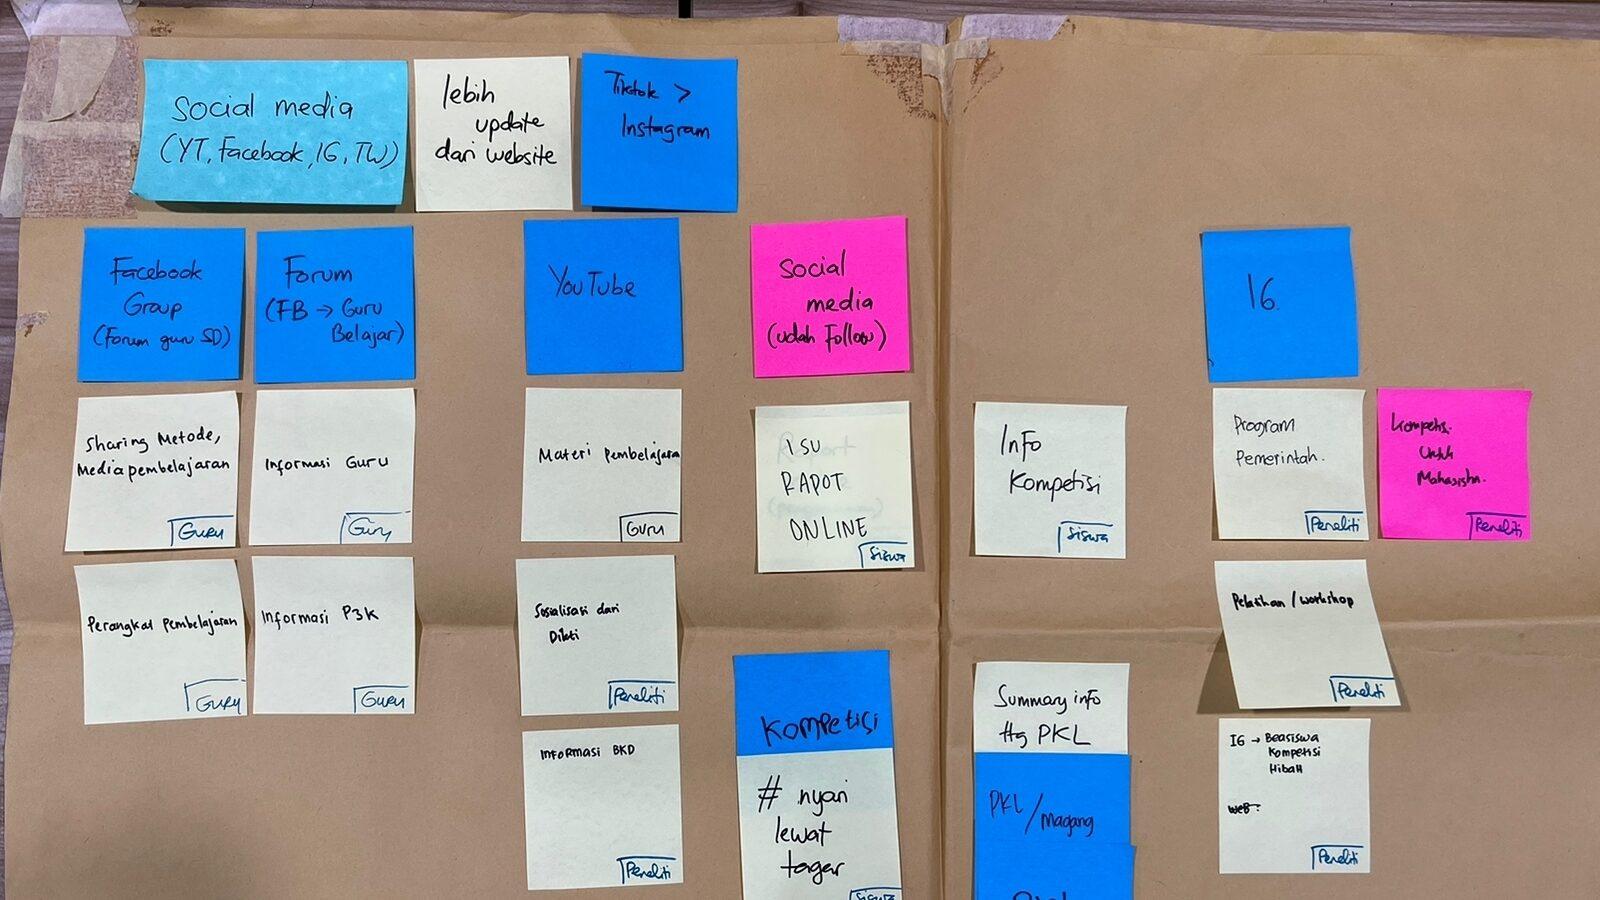
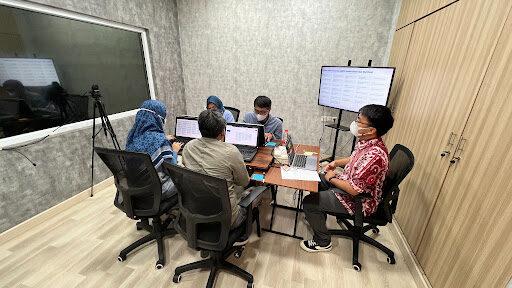
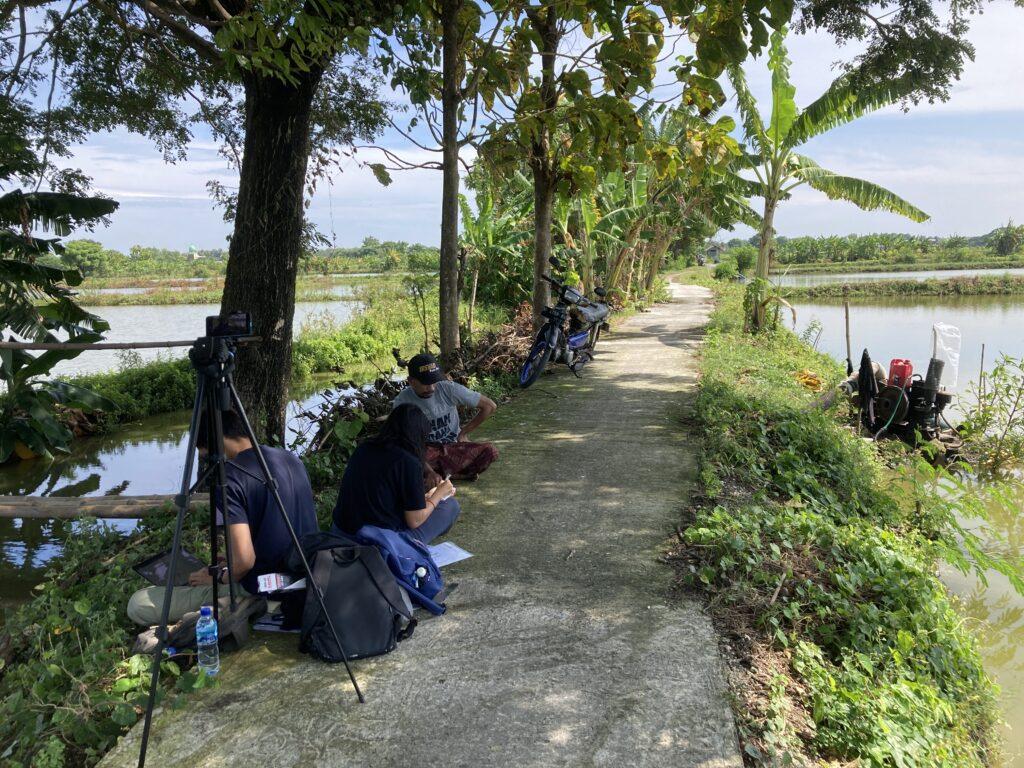
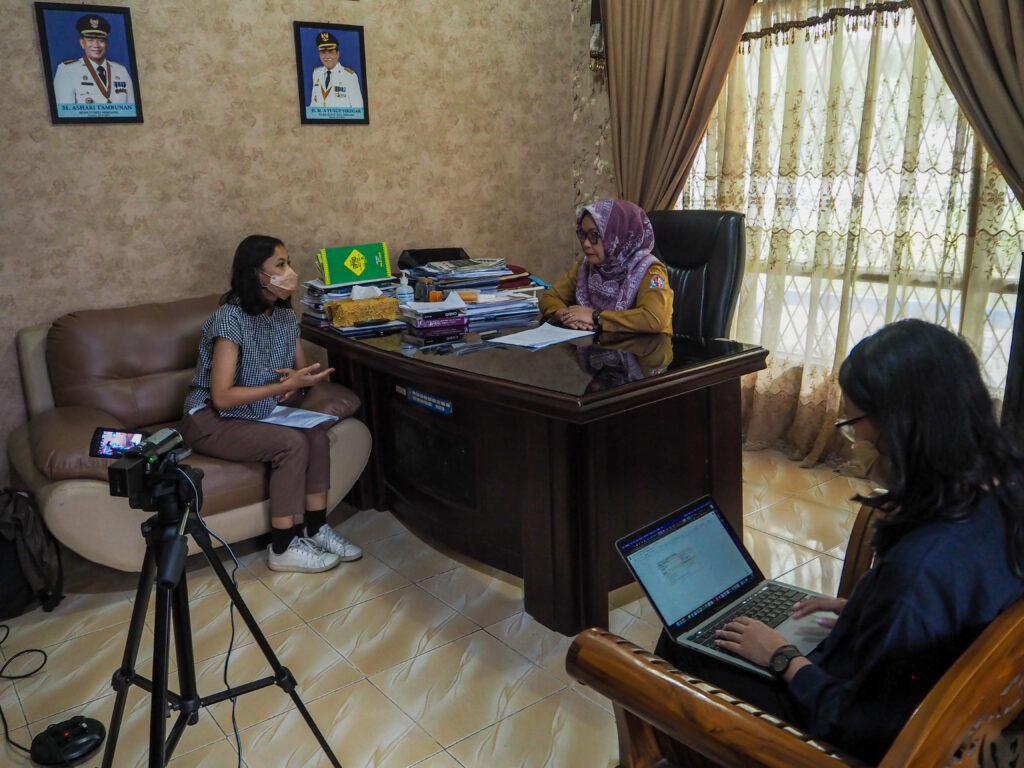
As support systems and infrastructure are crucial in digital financial services adoption, we started by understanding the context and mapping the ecosystem. This includes observing the infrastructure in the system, their roles, the communication used, etc. From our initial landscape mapping, we identified several key stakeholders and gathered data through transect walk, shadowing, and in-depth interviews with key government and service providers stakeholders.

PRODUCT AND PERSONAL LEVEL

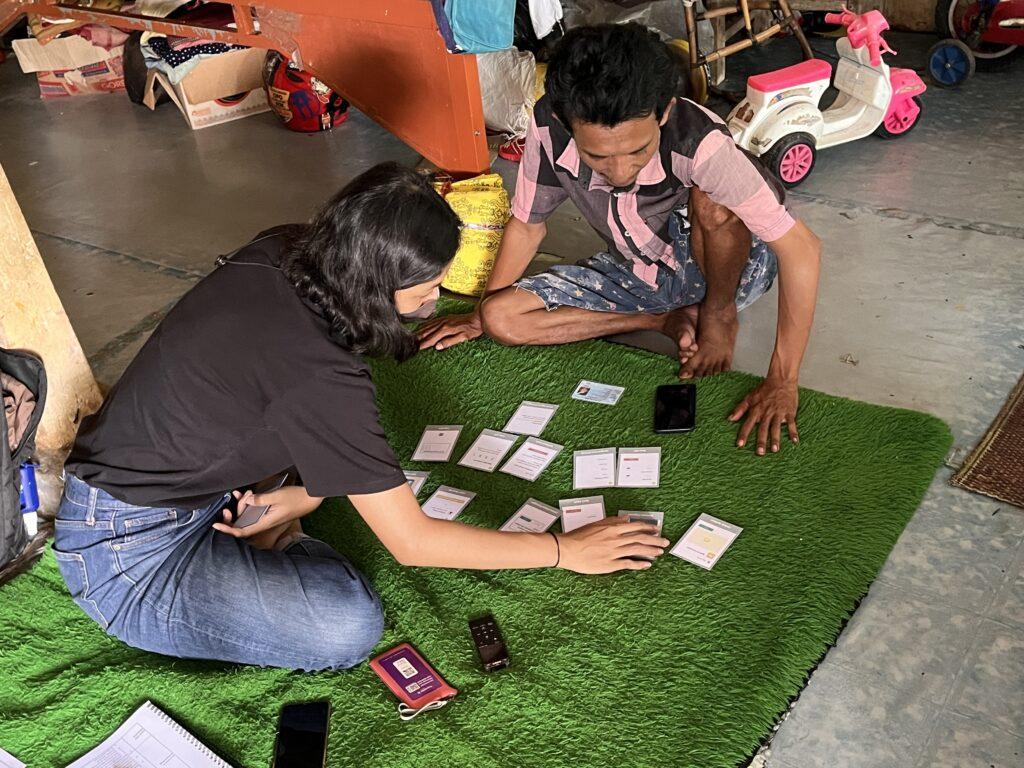
Understanding the products / services used and deep dive into the target group context, literacy and behaviors towards DFS as well as the detailed onboarding process. In this phase, we also dug deeper into findings from the ecosystem mapping and stakeholder & provider discovery. The data was collected from various methods such as intercepts, Focus Group Discussions, shadowing, fly on the wall to In-depth interviews.

Interviewing respondents in their farming land
Using stimuli to get honest reaction during the session
Talking to the local government to get the different point of view

Our Journey and Process

Phase 1 Project Visioning & Landscaping

This phase started with detailing the project plan, teams visioning on outputs, outcomes, and methodology. Then, followed with developing partnership strategy and outreach with financial service providers, sampling strategy and framework, design of research tools, IRB approvals submission, and market recce.

Phase 2 Discovery

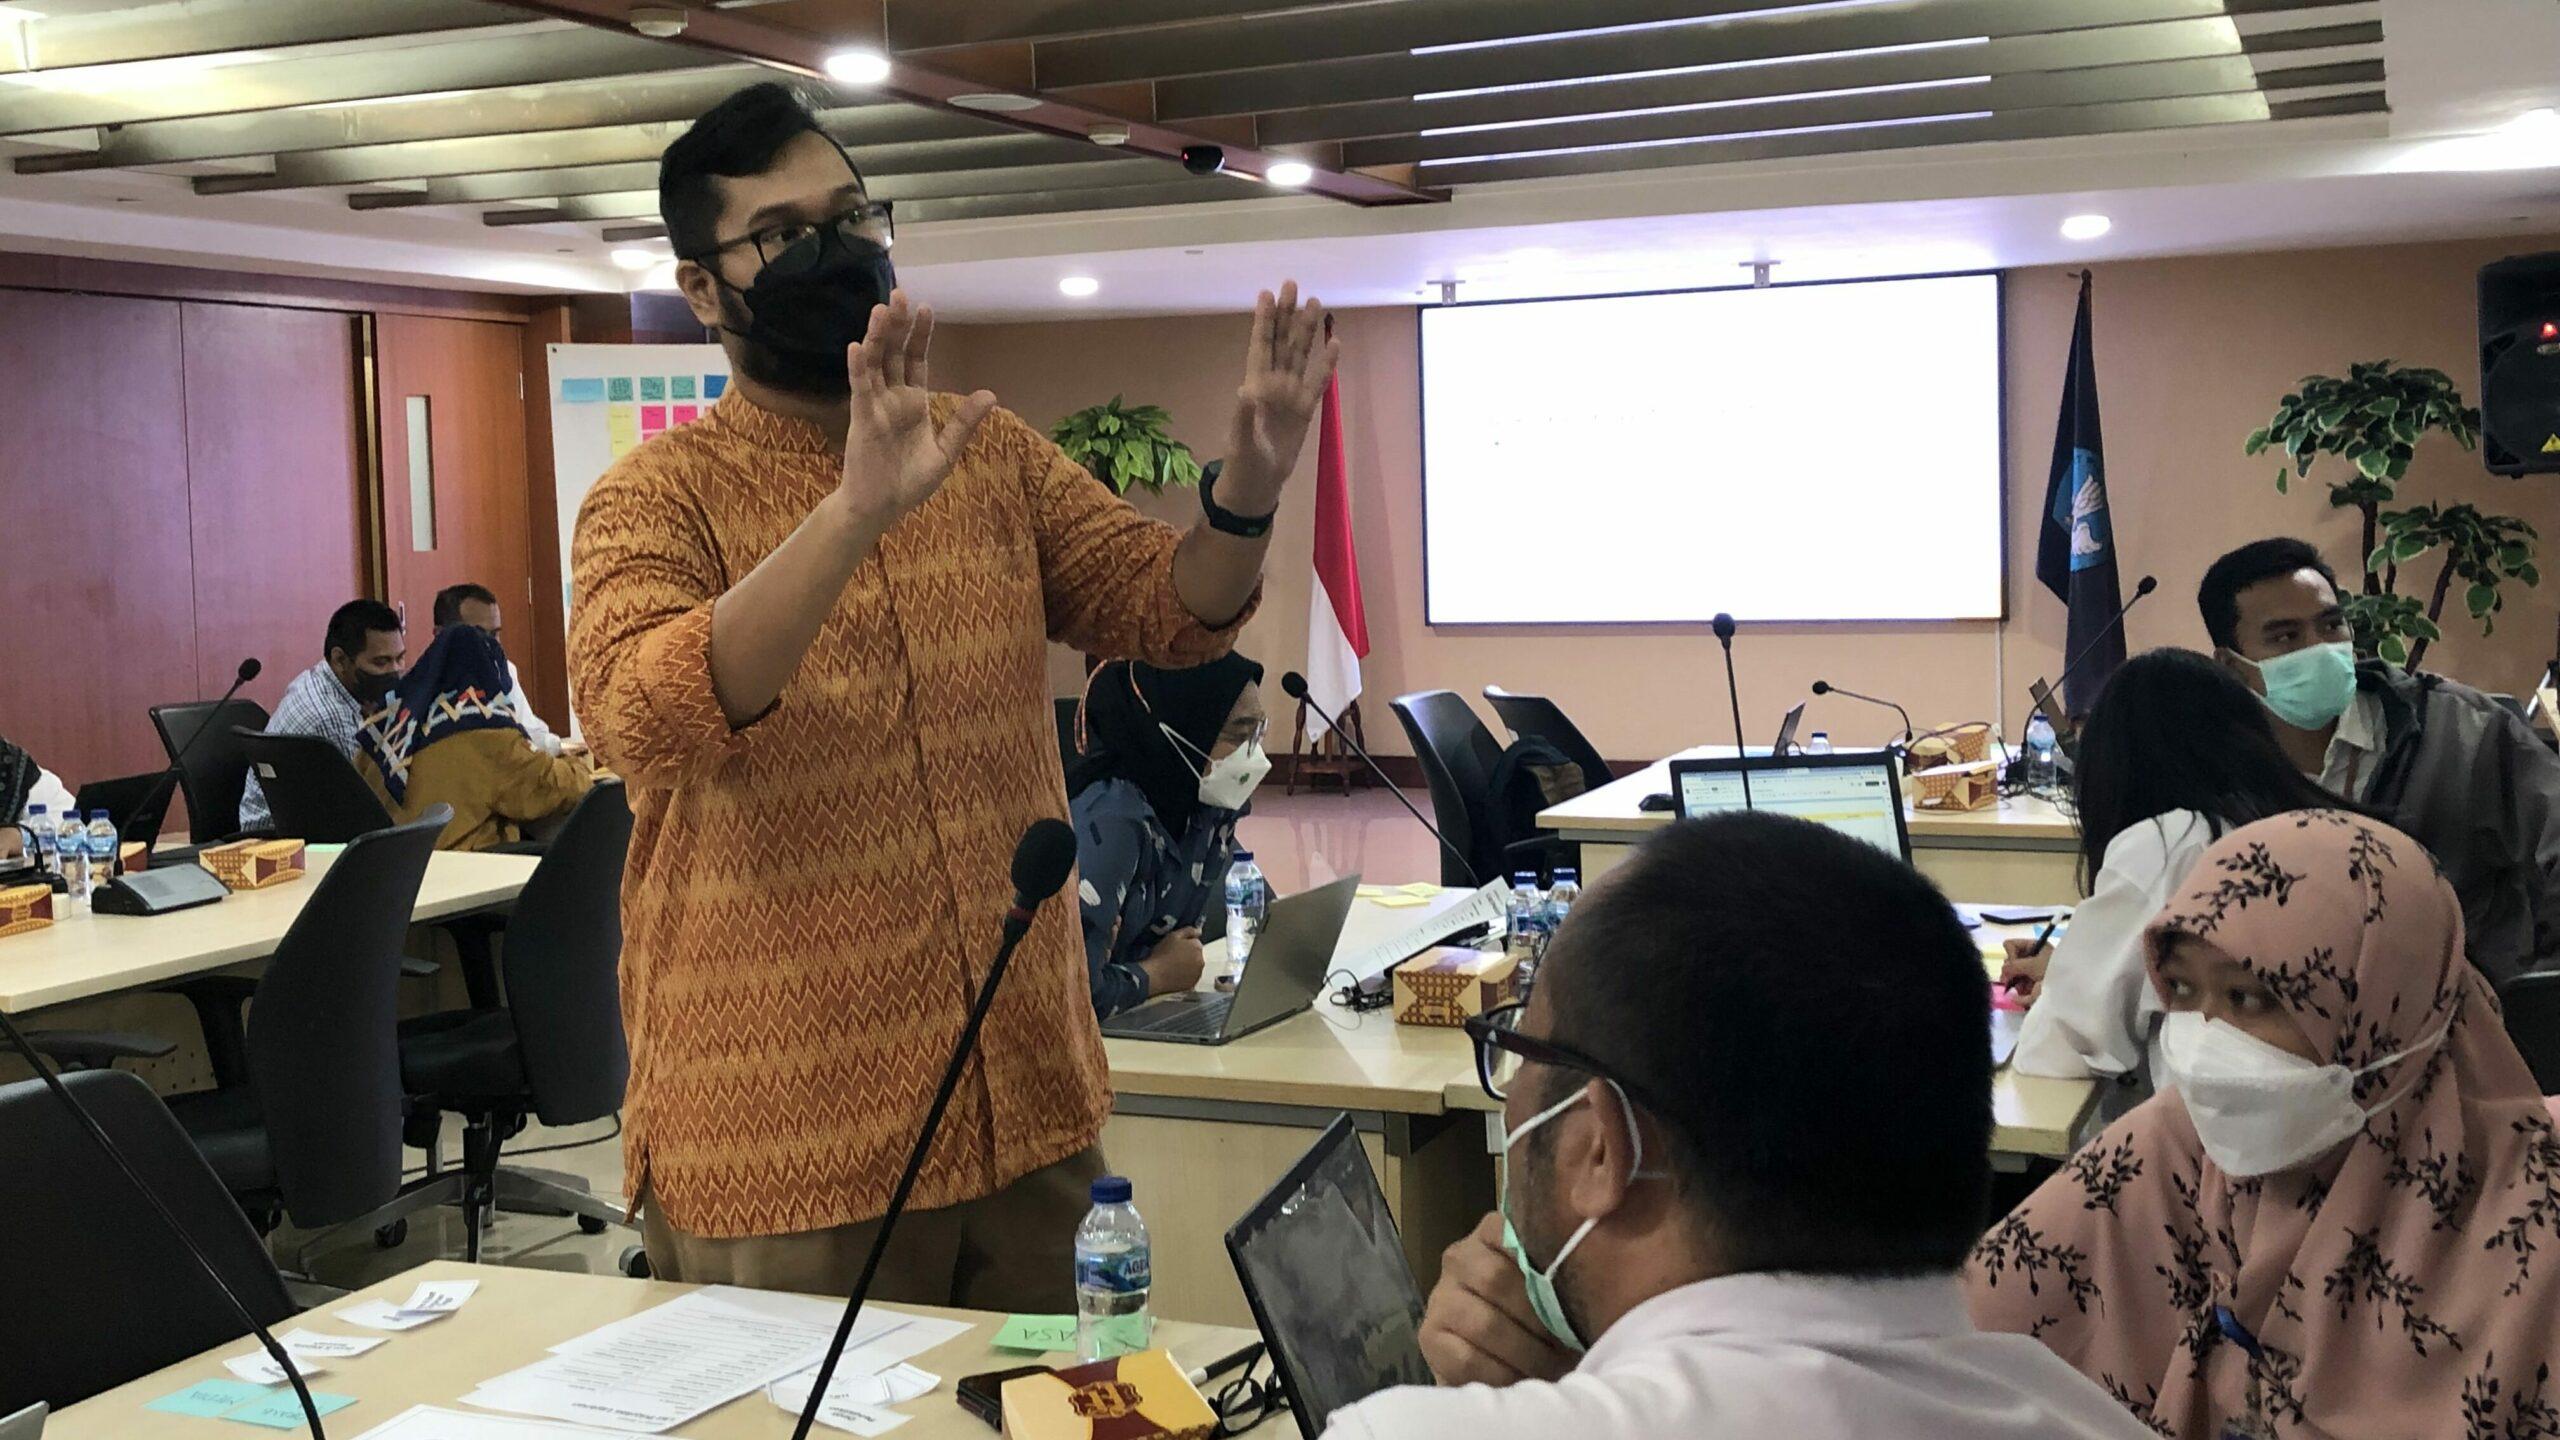
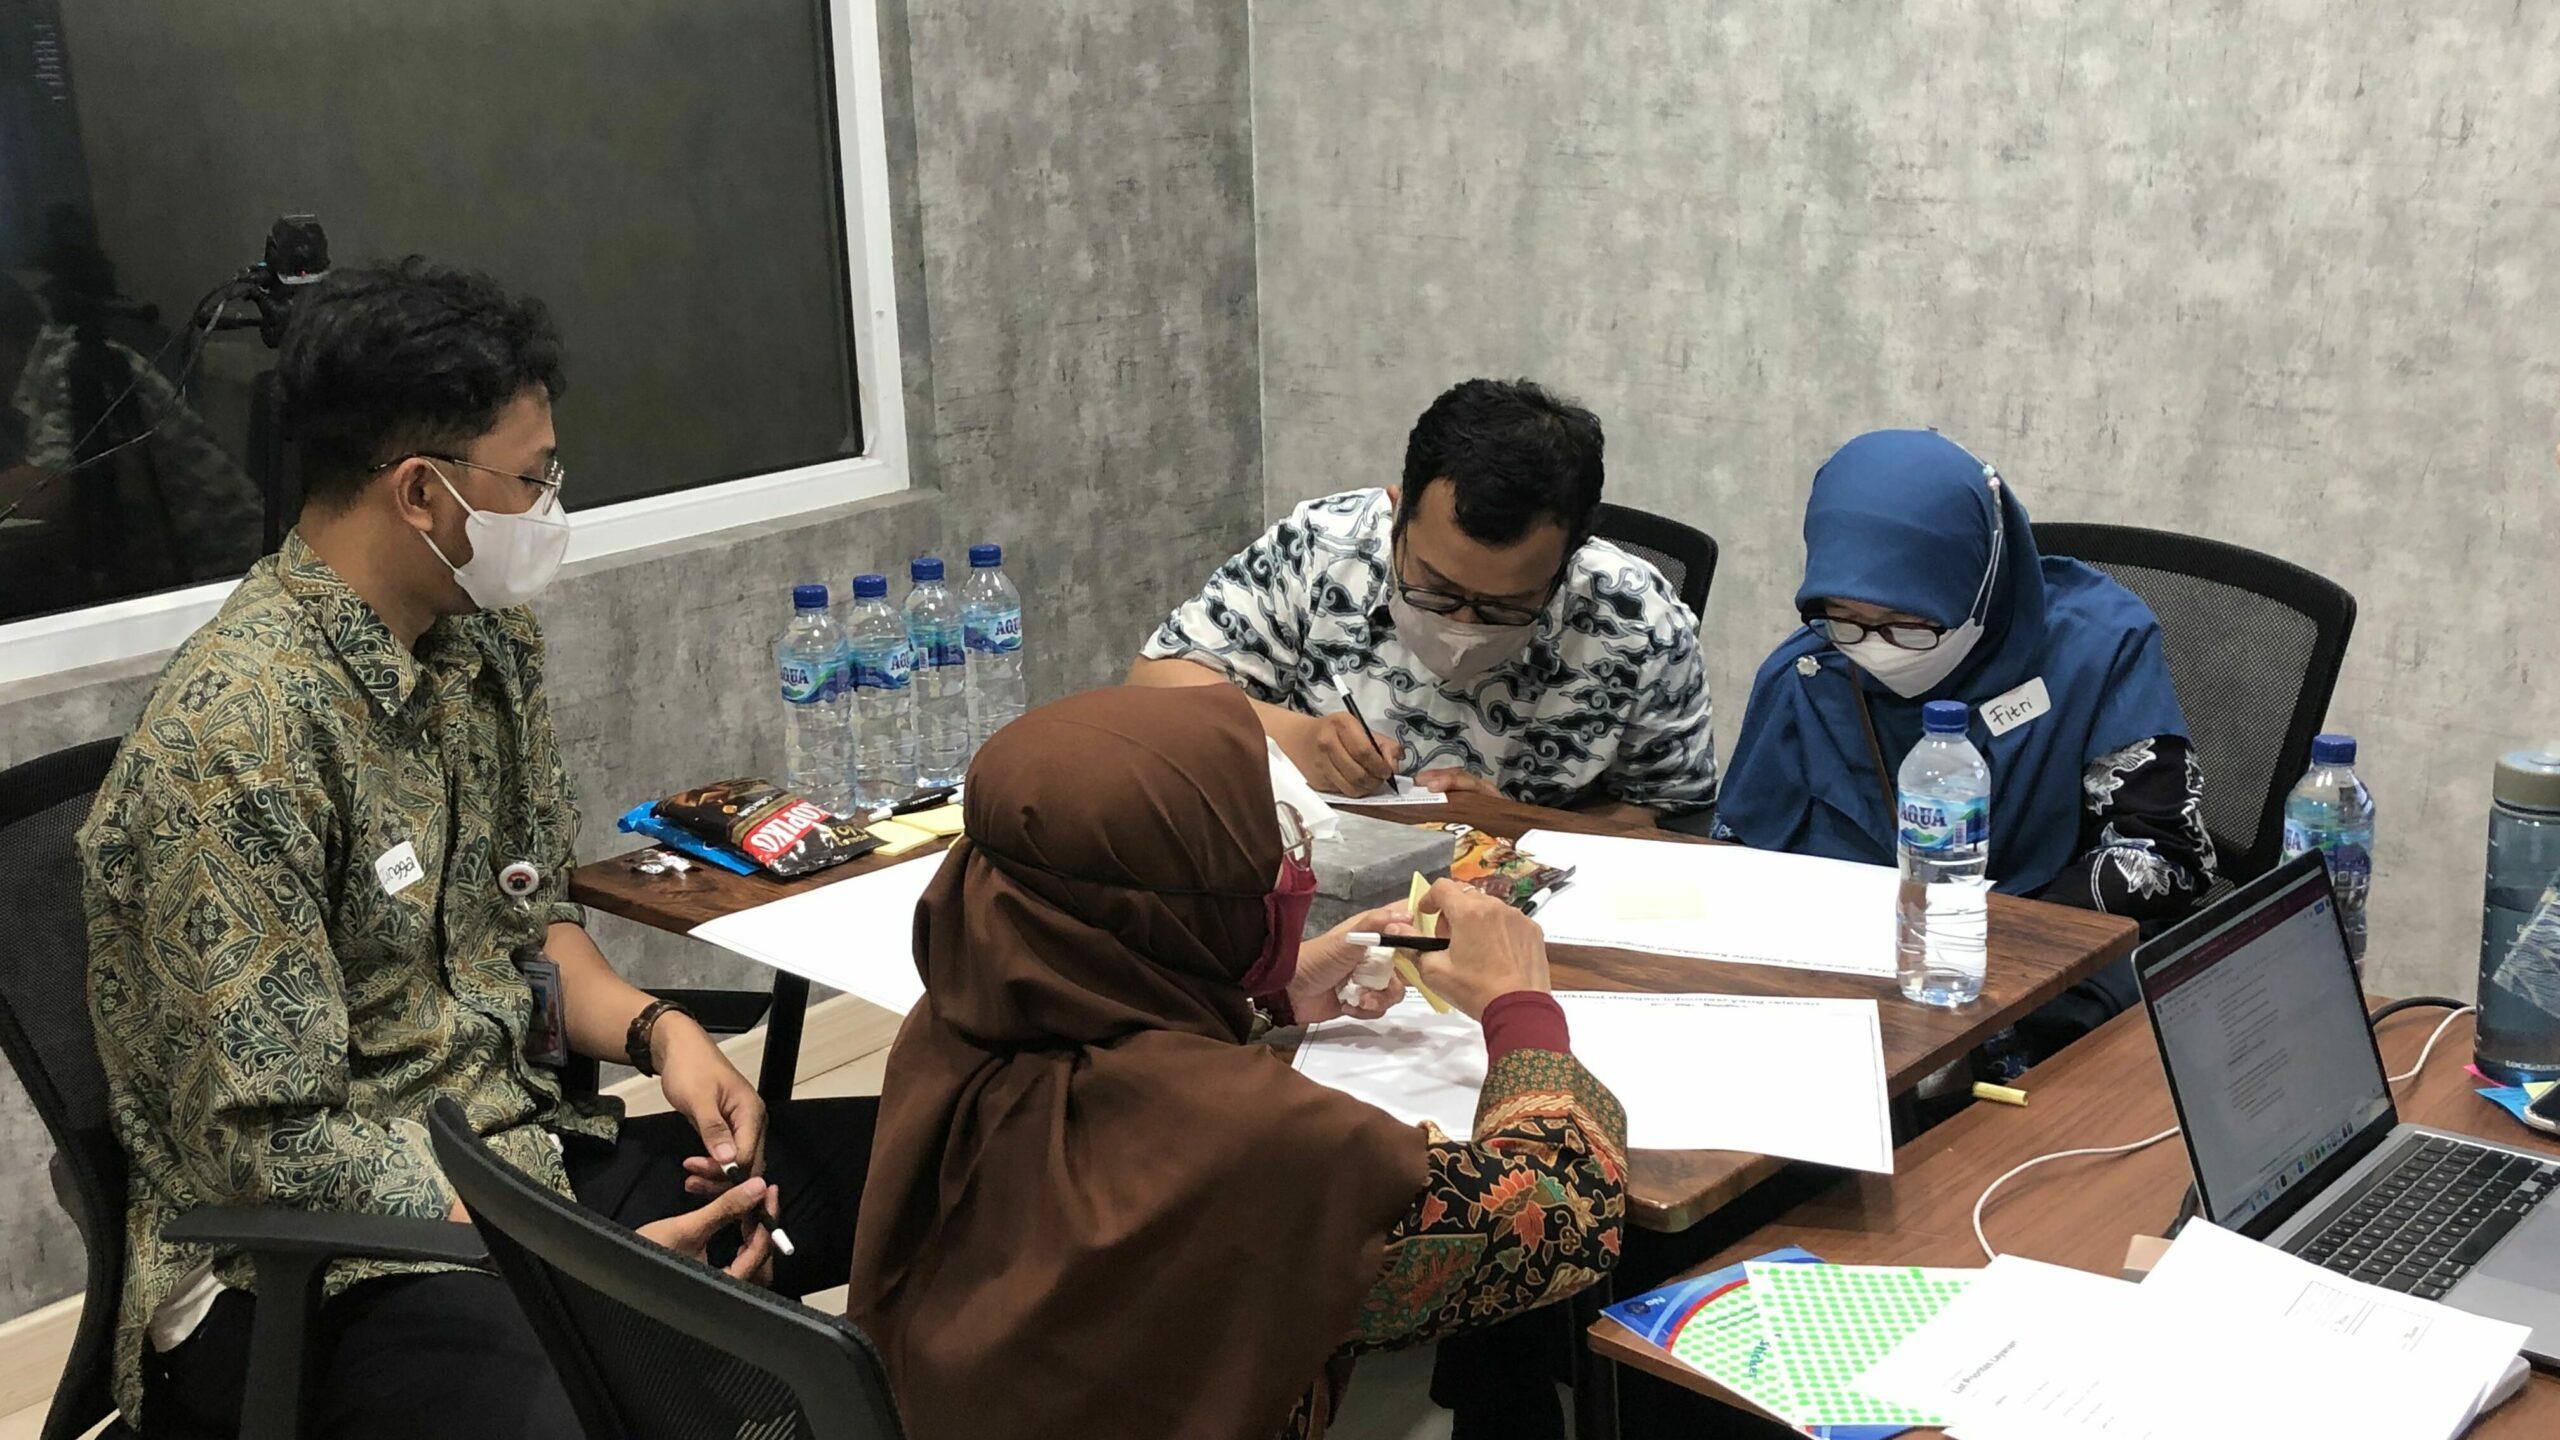
The phase is divided into 3 rounds of discoveries (field research). In each round, we did the analysis, synthesis, internal learnings workshop, country-wise socialization, feedback and iteration of the research approach.

Phase 3 Compiling Outputs and Dissemination

In the end phase of the project, we did analysis and sense making across all the three rounds of the discovery by country followed with compiling the global cross-country learnings. In parallel, we did country wise dissemination and is closed by global dissemination with relevant stakeholders.
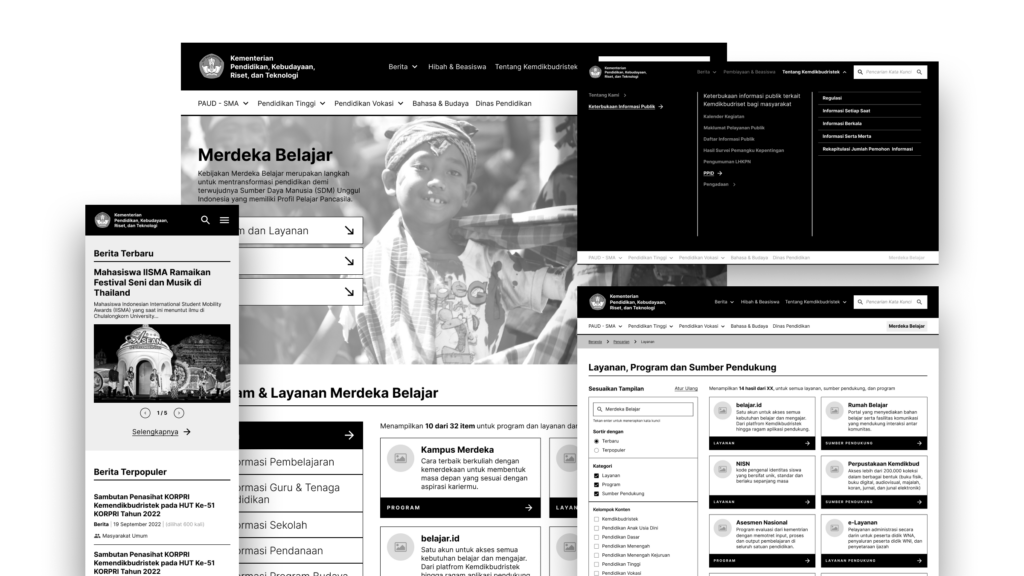
Illustration showing the challenges the unbanked and underbanked encounter when doing onboarding process
Delivering insight in the form of financial newspaper and distributing it at Indonesia Fintech Summit and Expo 2023
Sharing the insight in the Inspiration Stage at Indonesia Fintech Summit and Expo 2023

The Results

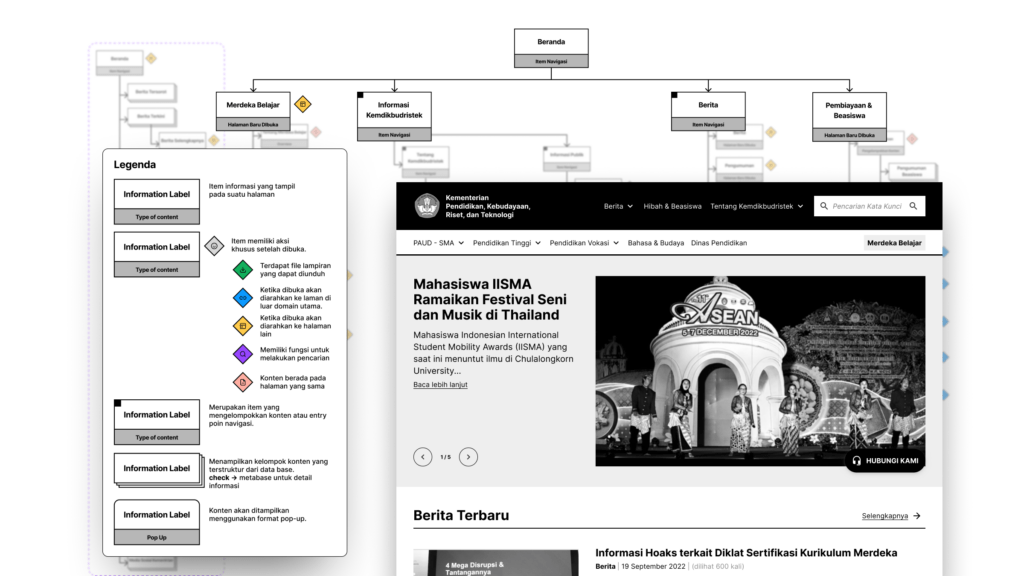
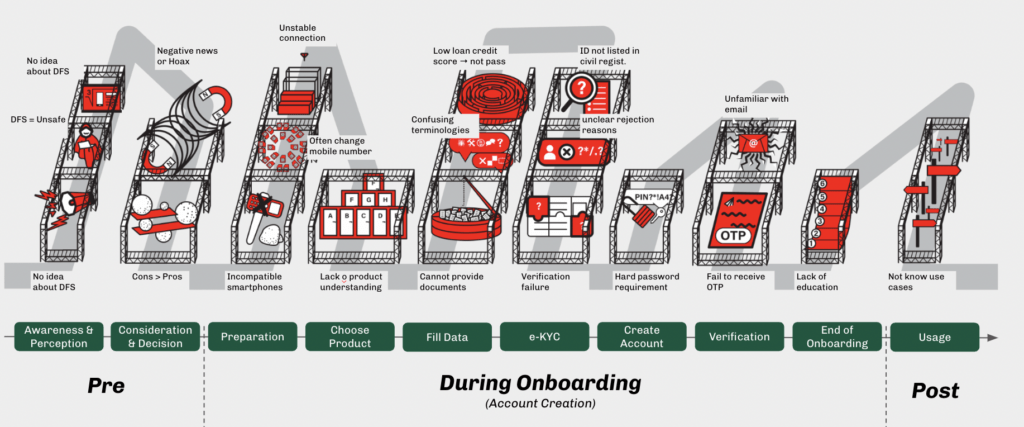
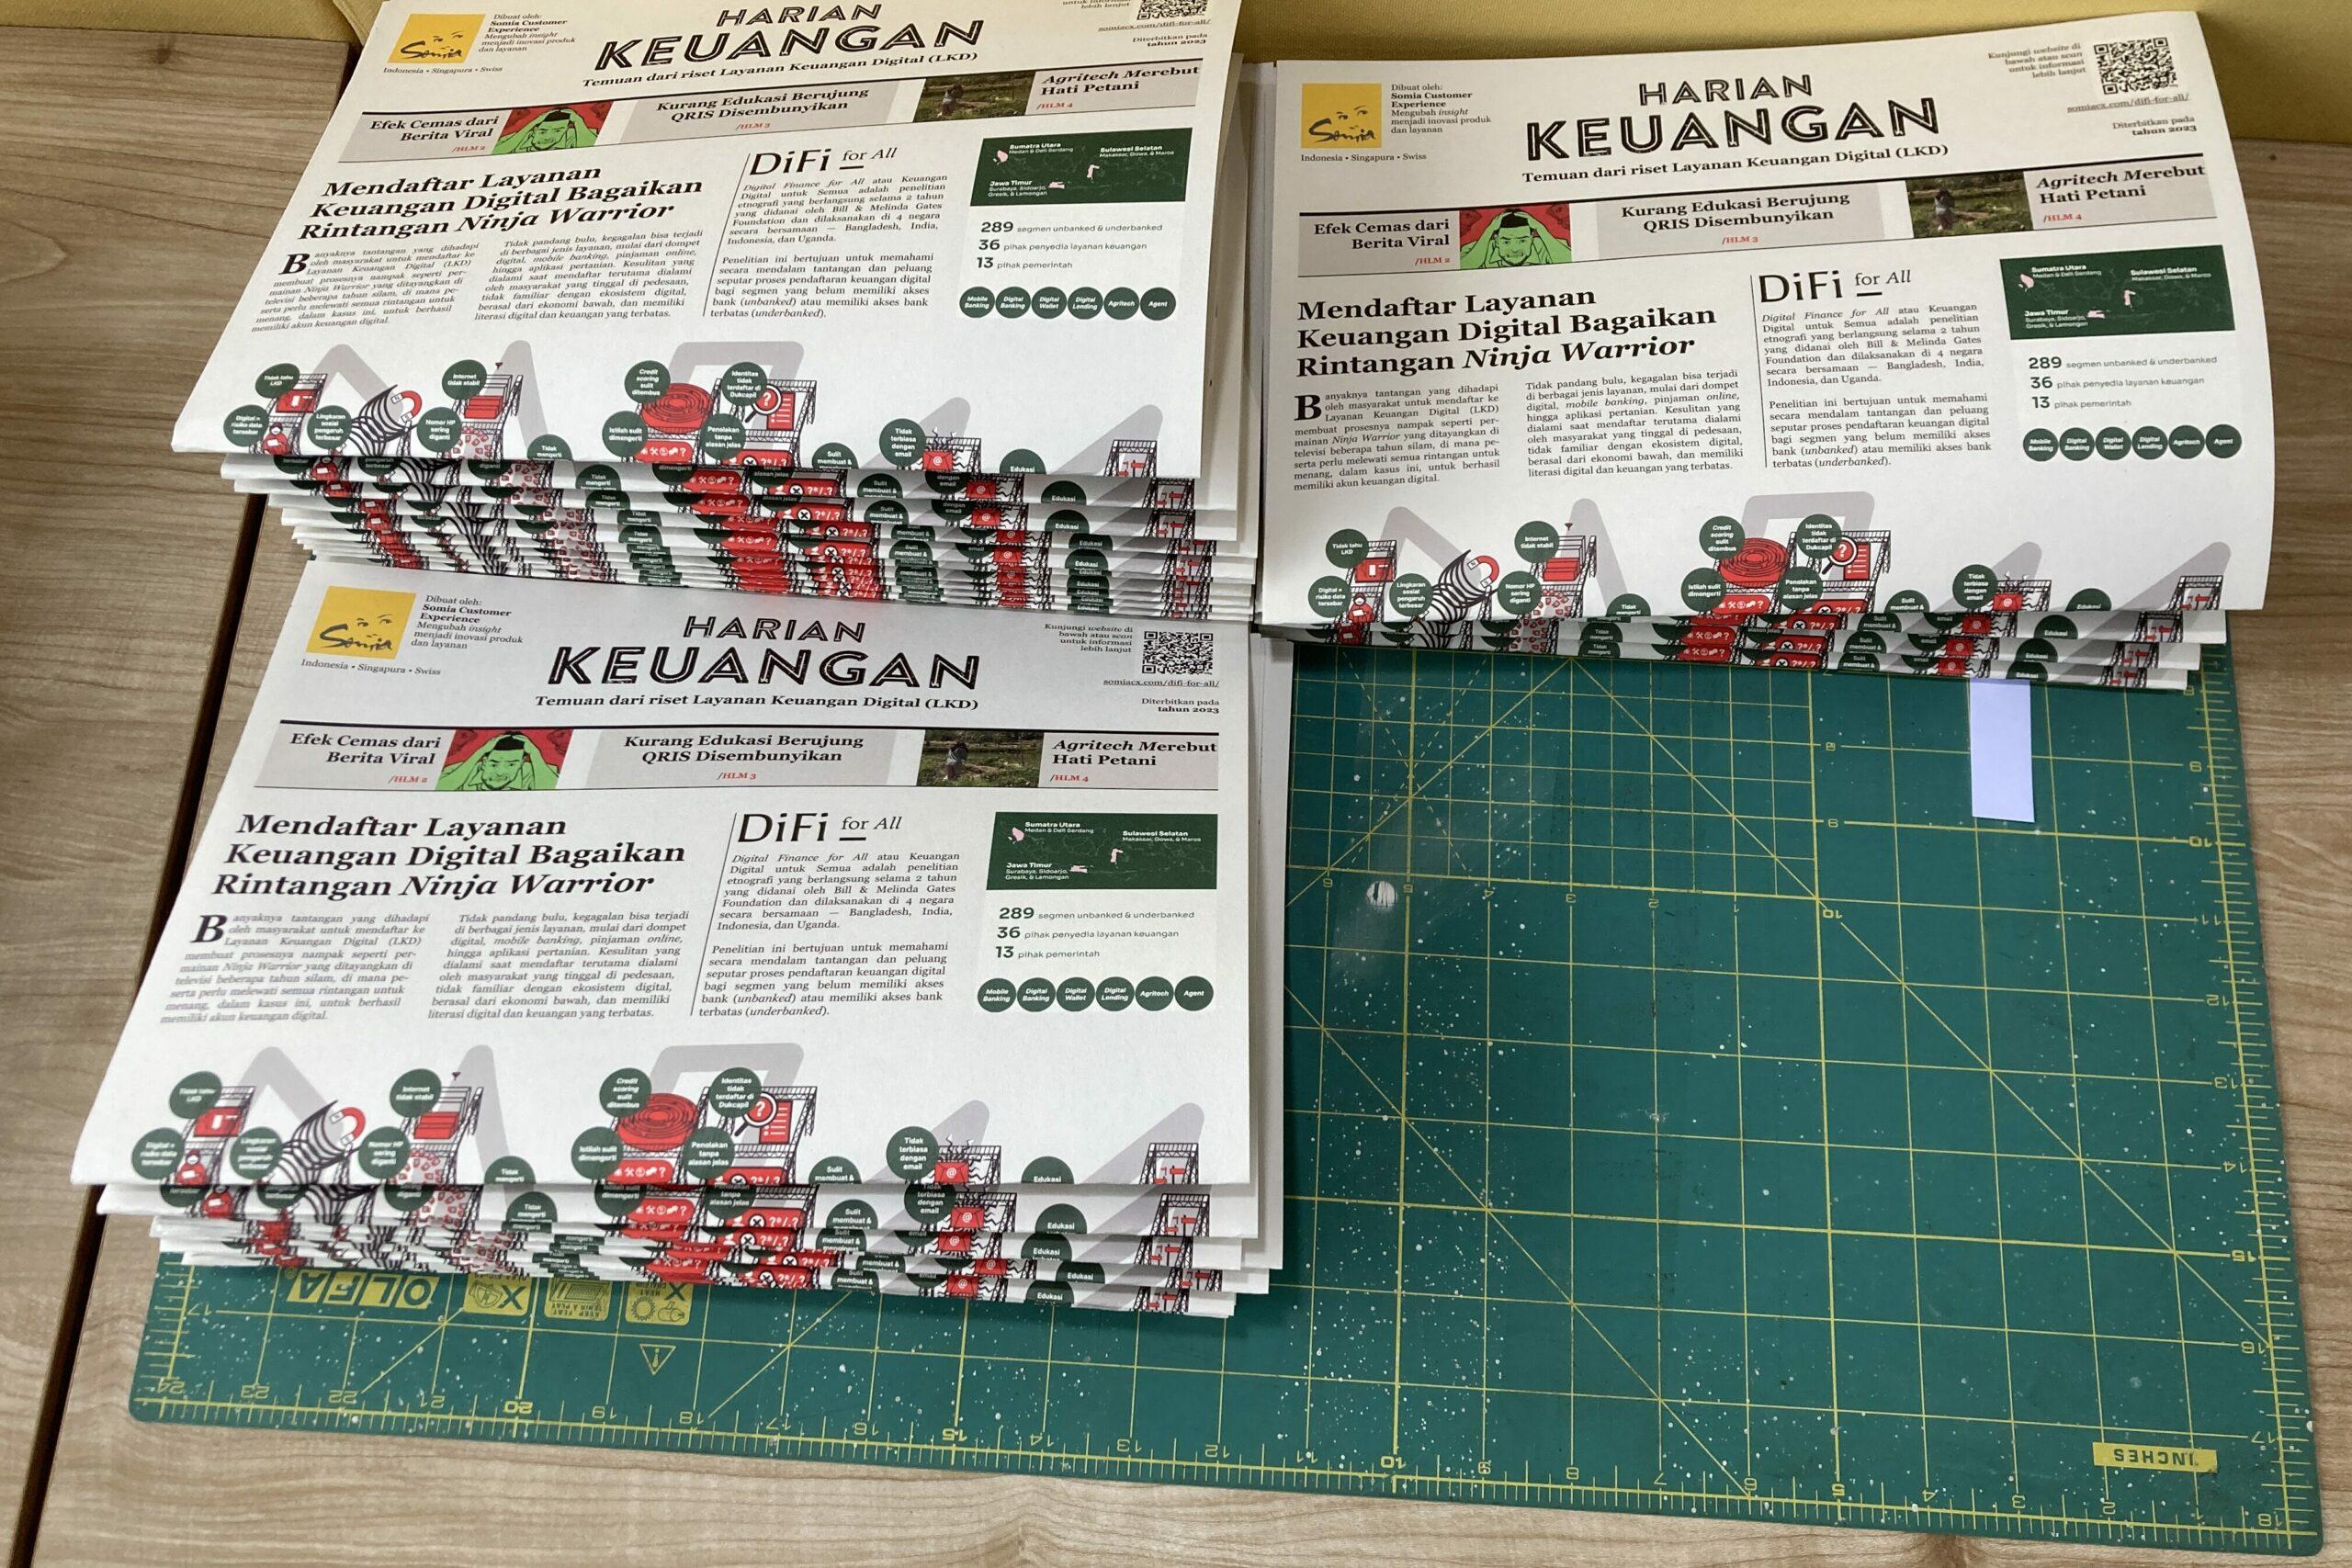
The insights that we gathered from the research are extracted in different formats, from journey mapping, illustration, and short videos. The key challenges are identified and mapped in each stage of the journey from pre-during-post onboarding, including awareness, perception, consideration, decision-making, and application to usage. 

The understanding of problem spaces in each stage is also equipped with the opportunities collected from good practices observed in the field and design principles as inspiration and to bridge the implementation.


Consultant in-charge

Chin Burkotler

Project Oversee

Uka-q-a-p

Uka Q.A.P

Partnership Lead

anindya-fitriyanti

Anindya Fitriyanti

Project Lead

rayi-harjani

Rayi Harjani

User Researcher

daniel-fandra

Daniel Fandra

Research Ops

See more our similar works

Collaborate with us!

Looking for ways to transforming your business?
Get in touch with us!

Our design approach for Kemdikbudristek website transformations

The transformations of the education system conducted by the Indonesian Ministry of Education (Kemdikbudristek) prioritize fast and accessible information dissemination. In response, the ministry wants us to help them adjust their main website portal so that it can be easily accessed by any stakeholder under their service.

The Impact

With the new directions, we treated the website as the main lobby. Providing its users with essential information and then guiding them to other detailed sources provided by the main department under Kemdikbudristek. The result is an information architecture with a concise and modular information structure that is still adaptable to accommodate future changes.

Our Approach

First, we need to gain buy-in from all involved stakeholders, including the main departments of the ministry. We began the project by understanding the main agendas of each department, the way they disseminate information, and the current information provided on the main website. Since the main goal is to make the website accessible to its users, we also conducted several FGDs (focus group discussions) to validate our findings and explore the needs and behavior of users seeking education-related information.

It is not easy to fulfill the needs of every stakeholder, especially with tight deadlines. Therefore, we decided to design around 20% of the information that is important for the remaining 80% of users while still providing room for future growth and development.

Our Journey and Process

Internal Context Gathering

We conducted this activity through an internal workshop with the 9 main departments of Kemdikbudristek. In addition, we gathered context by inventorying the information presented on the website to determine the type of content and the responsible department.

External Context Gathering

We spoke with our users through two FGD (focus group discussion) sessions. The first session used an exploratory approach to gather user preferences while seeking information and determine what information is essential to them. The second session used a generative approach to gather more ideas for our interaction patterns and information architecture concept.

Information Architecture Design

During the FGD sessions, we identified the design directions we will follow throughout the project. We will design our information architecture with the mindset of a lobby since each main department has established its information channel. We will provide essential information on our website and easily guide users to the correct places.

Wireframing Process

As our users can access the Kemdikbudristek website from various sources, consistency and familiarity were important considerations when designing website interactions. To achieve this, we deliberately limited the number of interaction patterns and created a specific grid system so that users could easily understand where certain functions would be located. Additionally, we avoided using pop-up based interactions as they can harm the analytics performance.

Design Handover

We understand that no matter how well we design the website, it still needs to be supported by good-quality content. From the choice of images to the content tagging, these will affect our users’ experience while looking for information. To address this, we provided our clients with documentation in the form of a project brief, which serves as a guide for them while managing their content.

Information Architecture and Wireframe as our deliverables

The Results

We redesigned the website’s information architecture and managed to simplify its current content. The new design is concise and modular, fits with user behavior, and is flexible to any future changes. Here are some interesting findings about our users that influenced the decisions we made.

  • Our users perceive the website as a valid source of information, but they do not use it as their main source. Instead of seeking information through websites, they rely on social media or internal channels such as WhatsApp groups. When there is a need for fact-checking, the website becomes their top choice.
  • Users’ preferences in grouping existing information depend on their intensity and intent while accessing it. For example, users who need to access a specific service prefer a more personalized structure so they can easily position themselves.

Consultant in-charge

chin-bw-2

Chin Burkotler

Project Oversee

Uka Q.A.P

Interaction Designer

Anindya Fitriyanti

Research Ops

michelle-susanto

Rayi Harjani

Project Lead

Daniel Fandra

User Researcher

See more our similar works

Collaborate with us!

Looking for ways to transforming your business?
Get in touch with us!